Hi! I will show you today an advanced chart, which you can insert in Excel. It is a Gantt chart.
You can use a Gantt chart in projects management. On a Gantt chart you will see your project schedule. Gantt chart illustrates dates of start and finish of all your project's tasks.
I will show you, how to make a Gantt chart with Excel.
First you need some table with tasks of your project. Write down a start date, finish date and duration of every task.
Check whole table. Now you have to insert a bar chart. The best here is a stacked chart.
Now you have to edit data sources. Right click on the chart and choose Select data. Remove a finish date from data sources. Data sources should looks like on the image below.
You see a basic version of a Gantt chart. You don't need a legend. Click on it and delete. Next click on a blue bar once and right click. Choose Format Data series. You don't need a Fill and a Border Color - check no Fill and no Border Color.
The next problem is a sequence of your tasks. Right click on tasks and choose Format Axis. Check a Categories in reverse order here.
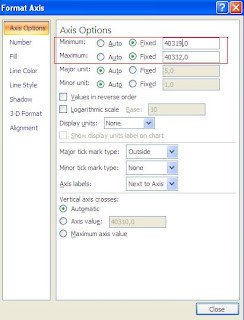
My chart starts too early and finishes too late. You can have the same problem. Right click on dates and choose Format Axis again. Write proper dates.
Nice work. Your Gantt chart is ready. Congratulations.


No comments:
Post a Comment