Today you will learn, how to make charts in Ms Excel.
You have some sales data.

Yours boss told you to make some chart in Excel. Take a look, how to do that.
First go to Insert section on the Excel's ribbon. It's on the top of the screen. You can choose many kinds of charts from there.

Next check whole table with your data.

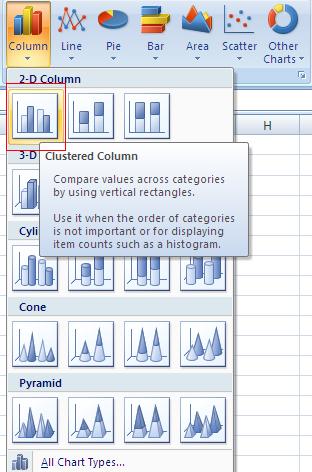
Now choose some kind of a chart. The best here is a column chart.
Your chart is ready. Thats how it looks:

You may also use some other kind of chart. It's 3-d cylinder chart:

That's a bar chart:

And that's a pie chart. Pie charts show data as a part of whole sales.

That's of course only basic informations about charts in Ms Excel. You will read more soon on my blog. See you next post.
No comments:
Post a Comment